
How to measure the ROI of open source communities


👋 Hey, it’s Jaime. Welcome to my weekly newsletter, where I share how thriving open-source projects grow their communities.
Subscribe to get access to these posts and all future posts.
In this week’s newsletter, I’ll show you the different ways you can prove the ROI of your open source community to help you gain support from those funding your budget. We’ll cover:
The value your open source project has for society
The value open source and community have for your organisation
The questions you need to ask to start measuring in practice
How to communicate your ROI to gain your Organisation’s & Community’s support
Some precautions to keep in mind
Read-time: 16 minutes
If you struggle to convince people to give you funding to develop your community-driven or open source project, you’re not alone.
At some point in the journey, many creators who want to share an idea openly and gather a community struggle to find resources to create or maintain their project, end up letting it go, or continue with no resources until burning out.
And this is also bad for the organisations depending on your open tools and the communities that found a place to do the work they couldn’t do otherwise.
There is the common belief that once it’s launched, an open source project and its community can become autonomous. And people are often very excited to think about how much money it can save.
Instead of investing in them and creating thriving ecosystems like Wordpress, Wikipedia or Arduino, many projects are launched because they are useful to the creators, but since there are no financial resources set aside to support them, the projects are not maintained. And when an open tool used by millions of companies goes down, like OpenSSL or Log4J, then millions of people can lose their work, savings or worse, their identities.
Open source and community programmes have the same opportunity cost as any other investment. Every precious euro invested in them is a euro that can’t be invested in anything else. And a successful community doesn’t come cheap; a typical community budget for a major brand ranges anywhere from $500,000 to $10 million+ annually.
And most private investors are also reluctant to invest in it because they see open source as a liability that will increase competition and turn their products into commodities that sink their prices.
How do we know it’s working? What’s the actual value of an open project and its community, and how do you create a system of metrics, reports and dashboards to show the benefits and impacts, whether within a company or for the economy overall?
As long as we’re not able to answer these questions and prove the project’s ROI, we won’t be able to get funding for our existing or future projects, and leaders who need to be convinced about the value of openness and community won’t get on our side.
The good news is that there are plenty of community builders who have been working on proving the value their nebulous community project’s have and how to persuade their funders that it’s a good idea to invest in them.
Today I’m going to show you how to justify the ROI of any community-driven or open source project.
By being able to explain the results open source and your community are driving for your organisation and society, you might get more internal and external resources.
And by sharing how open source is also helping drive economic value, we might unlock more public funding to support open source and community building, rather than proprietary and monopolistic solutions.
So I’ve created this mini-guide with reliable frameworks to give you a simple methodology to help you sell the value of any community or open source project.
I hope it’s helpful.
Understanding The Value Your Open Source Project Has For Society And The Economy
There are different levels for measuring value and different methods used—to dive deeper, I’ll share more resources at the bottom of this article.
If you are working for a public agency and have to choose what projects to invest in, you have to measure their impact on the economy and society.
Investment in an open project is very similar to investing in physical infrastructure (roads, public services, and telecommunications) and its economies of scale.
Software, methodologies, designs or data can have high fixed costs to produce the resource, followed by low marginal costs. Or, with a little less economic jargon: starting is expensive, but each additional user entails relatively low costs.
An electricity company has high initial costs, but once its infrastructure is in place, each additional customer is cheap.
As a result, these types of industries tend to become monopolies due to economies of scale. It's simply cheaper to centralise these high fixed costs in one place and harder for new entrants to overcome them.
But open projects can also become decentralised monopolies. When a decent open source alternative enters an industry, it often replaces the dominant closed players.
Inviting communities to study, modify and even sell a product or service is the easiest way for an idea to spread and get a trusting audience. It’s also the easiest way to get people to help you improve it and trust a project.
And in return, an open project creates a series of benefits for the economy that can be measured by:
Resources, skills or capacities saved or created
Jobs or new incomes created
New investments made by the ecosystem
Decreasing inequality
Unfortunately, most open source creators, don’t have a system for measuring the benefits they deliver, both to funders and their community.
And even if it should be easier, financial support for your project won’t happen by chance. It comes from an intentional effort to explain the value we create.
Here are some examples of questions we can use to understand the invisible impact your open or community project can create:
What would be the cost of replacing every open source alternative in use?
"... results show a cost of $4.15B if society had to replace these [OSS] packages once, but a cost of $8.8T if each company that uses these packages had to rewrite every package it uses" (source)
What would be the cost of not having an open standard but a monopoly player?
We’ve seen how patented medicines can be subject to price gouging.
Open alternatives lower prices by enabling competition, which increases its users spending power by taking away the price-fixing power monopolies have.
During COVID there was a shortage of medical respirators, normally priced between 10,000 and 40,000 euros. Makair worked to create an open source alternative made out of standard parts available off-the-shelf that could be made for around 500 euros with locally-sourced parts.
Compared to the millions of dollars hospitals have to invest to get an MRI Scanner, Open Source Imaging is creating MRI prototypes that cost around 20,000€ in materials, which would allow these technologies to be more readily available everywhere.And without an open or generic alternative, EpiPen—an Epinephrine autoinjector for millions of people suffering from anaphylaxis—has seen its price go from $94 to $609 in the US since Mylan got the rights to produce the product from Merck. Since 2007, the company has made tweaks to the device that allowed it to obtain new patents that would extend its monopoly and stave off production of any generic versions of the EpiPen.
Creating an open standard can also create savings by avoiding investments in multiple solutions.How much market value, jobs and income does it create?
Wordpress is valued at $3 billion, but it is estimated that its open source solution has enabled markets across the world to generate $143 billion in revenue every year by their community members.
RISC-V is an open-chip architecture ecosystem that's doubling every year and is expected to go from $52 million in 2018 to $1.1 billion in global market revenue by 2025.In 1993, Tim Berners-Lee and the CERN put the web into the public domain, a decision that has fundamentally altered our society and created trillions of euros in economic opportunity worldwide. This choice for public domain showed the potential for creativity when users have open access, as opposed to only well-funded corporations.
How much would you be willing to invest if it was gone?
If we took away Wikipedia, the seventh most visited website in the world, people would be willing to pay $42 bn. And yet, in 2020 they "only" received $127 million dollars in donations. Compare that value to the revenues and costs of running similar websites like Google, Facebook, Twitter, or Amazon.
Sequoia, a venture capital firm from Silicon Valley, is offering grants to open source developers without giving up equity or ownership or expecting a return on investment because their companies depend on these open infrastructures for their success.How much value is generated if you invest 1€ in open source for the economy?
In 2018, companies in the EU invested 1 € billion in open source software, impacting the overall European economy by 65 to 95 € billions.
Spillovers: How many unexpected managerial, social or economic benefits or resources have come out of this project?
The Arduino project has enabled thousands of new companies to get started or enable a new generation of industrial automation, and it has scaled the education of millions of designers and engineers through its open tutorials and courses.
Research funded with our taxes gave us the iPhone or covid vaccines.
We need to use flexible and dynamic metrics, but also stories that capture the cross-sectoral spillovers that happen—often serendipitously—through the community.What present and future resources (i.e., forests, water, privacy, saved emissions, living species, landscapes…) are we preserving?
If climate activist Luisa Neubauer and the Fridays for Future won the closure of the Lutzerath coal mine in Germany 8 years ahead of schedule, the equivalent of Greece's carbon emissions would be avoided annually.
If Camille Etienne wins to have deep-sea mining banned in French waters, millions of tonnes of C02 could be saved.
If Vanessa Nakate manages to stop the most extensive pipeline in preparation in Uganda, which will make each year the equivalent of 10% of the carbon emissions of a country like France. In that case, we would save a massive amount of emissions.
Consider the direct or indirect value your project is creating or protecting through the people using it and the cost to society if you had to suddenly stop it.
Understanding the Value Open Source and Community Have For Your Organisation
If you are working at your organisation’s level, you’ll have to measure the impact on your sales or savings. These values can be:
Support, Product development or Research savings : How much are we saving on support, product development and R&D thanks to the community?
Retention: How many more customers are we able to retain?
Sentiment/ Satisfaction: How satisfied are users with the impact the community or the open project have had on them?
Increased usage and adoption: How is the community contributing content, referrals and signups? How are openness and community impacting the increased adoption of the project?
Revenue: How are community members driving more revenue to the project?
These value dimensions will allow you to simply explain the impact your project is having and how to position it to gain support from internal and external funders.
For example, back in 2020, Richard Millington had to prove the value of a client’s community:
Despite the community's size and scale, the community team had been downsized the previous year and their budget was being squeezed each year because they couldn't clearly prove the value of the community.
Yes, they had used the call deflection templates you can find online, but the senior execs simply didn't believe the metrics were real because they were higher than the cost of the entire support team.
It's almost impossible to prove if someone a) got an answer and b) would've called support).
[…]So we removed the community from search and spent a few nervous months seeing what would happen (more on how we spend this time later).
[…]
During the four months, the following things happened:
1) YoY community visitors dropped by 83%.
2) YoY total support tickets increased by 58%(!!!).
3) Customer satisfaction (not shown) plunged because support staff couldn't handle the increase in support tickets.
4) This data showed that for every 207 visitors to the community, 1 would've contacted support (note this is a LOT lower than the 1 in 20 or 1 in 5 you often hear about). 🤯
5) However, the community gets 33.8m+ visitors a year. That's around 163k+ deflected tickets per year. Given each support call (according to the VP of support) is $18, we can now say the community saves our client $2.94m per year. On a budget of $855k in 2019, that is an ROI of around 244% (which feels about right).
6) Execs seemed less concerned about the $ savings than the rapid decline in customer support satisfaction. 🤔
7) While $3m in savings per year isn't huge for a major tech brand, we showed it's 72% cheaper to solve a ticket in the community than a support agent. This shifted the conversation from 'is community worth it?' to 'how do we make people visit the community first?' 🙌

So proving ROI is definitely a chore and requires a very experimental and courageous approach, but as you can see from Richard Millington’s experiment, you can go from having your community project downsized to getting the folks responsible for your budget to increase it.
Putting it into practice
Ready to start measuring the value your project creates?
Here are four simple questions to get you and your team going that I learned from Max Pete and Brian Oblinger:
Goals: What business, social or environmental challenges are we trying to solve?
“We need to reduce our support costs”
“We need to increase the number of people riding bikes”
Strategy: What is the approach and initiatives we will take to meet those goals and how can we align that with the community?
“We will build a self-service support community”
“We will connect associations promoting bike adoption, bike and bike-lane manufacturers and local administrations"
KPIs: How will we measure the performance of our strategy?
“Euro value of community-served support queries”
“Number of people riding bikes on pilot roads every month”
Metrics: What data will we need to calculate our KPIs?
“# Visits, Survey Results, Cost Per Case, Community Cost”
“# of new riders, survey results to measure increased satisfaction, cost-savings from fuel, road maintenance or social insurance”
Once you’ve narrowed down these questions, where can you access the data?
You may have to work with a data analyst, researchers or get help from the support team to get this data, think of control groups, and put various metrics together.
You might also get this data from user surveys you send, like the one used by Marty Neumeier to measure your users’ empowerment.
Ideally, you have a single place where you can get the whole picture of your open impact together.
If the data doesn’t exist, what will you do? With whom can you work to gather it or create it?
How can you communicate it?
Once you have all of this valuable information, how can you let other people know?
There’s no “right” way to do this, but here are a few examples of how you could approach it:
The Internal ROI PDF
This one is from Brian Oblinger’s playbook.
You can make a 1 page pdf to report your main metrics internally, and share it with your key stakeholders to communicate the project’s progress, value, and what's next.

Here are the critical components highlighted by Brian Oblinger:
Quantitative (Numbers):
Select 3-5 of the *most important* metrics that you believe stakeholders need to see. These numbers need to be easily understandable and tell a story.
Show some sort of comparison to a previous timeframe (MoM or YoY) to bring context to the numbers. This helps people understand where you've been, where you're at, and potentially where you're going.
Highlight something important in the large chart. Dive deeper into a specific outcome to drive home a point. Recommendation: show something here that illustrates ROI or impact, if you have it.
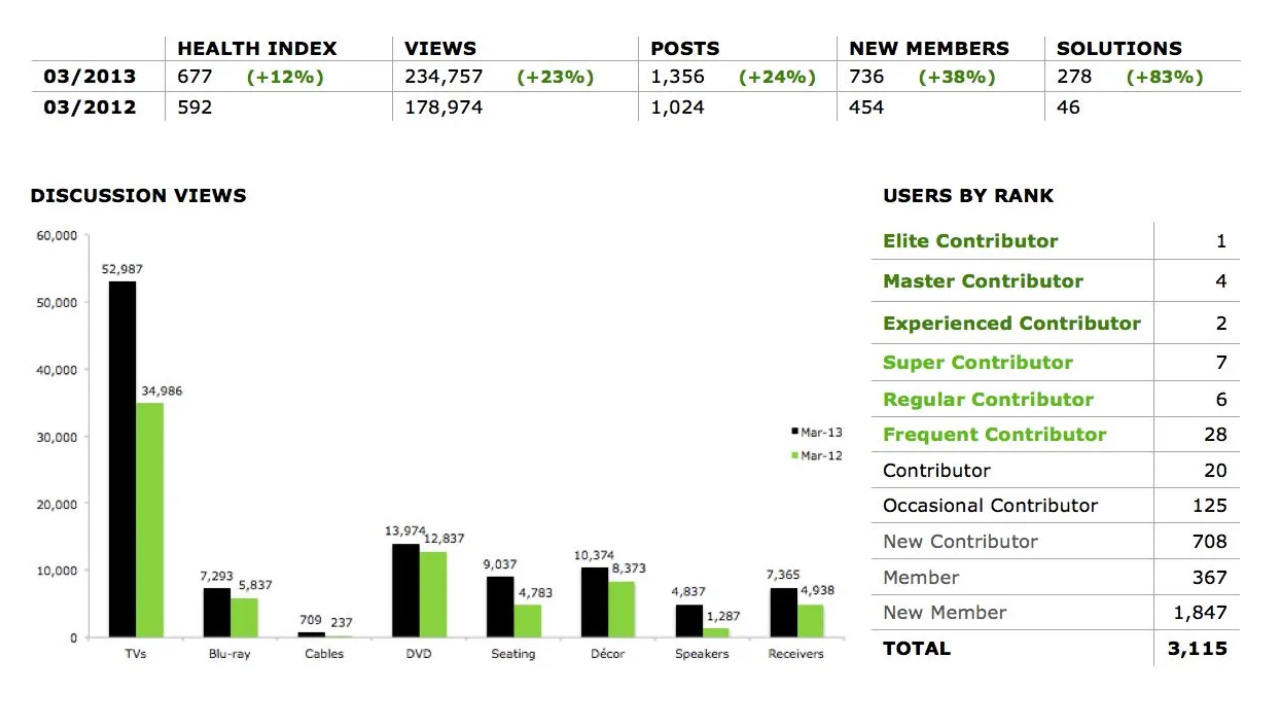

Qualitative (Narratives):
One of the biggest mistakes people make is that they throw a bunch of data at their stakeholders, but never tell a story. Bring *clarity* to what's happening and what it matters. - Brian Oblinger
Dedicate 1/3 of the report to qualitative storytelling and outcomes:
The examples in the fictitious report below are mainly focused on a support community, so feel free to adapt them to your case.
Highlight hot topics, important product issues, great contributions by members, programmes you've run, and much more. These can remain static or change each reporting cycle depending on what resonates
Reserve a portion of the report to highlight members. It's important for internal stakeholders to understand these are real people.

Roadmap (Notification):
Showcase your progress. Brag a little bit by showing how much you're doing. This also sets expectations by showing your team’s activity.
Eliminate surprises. Show them where we're going and when
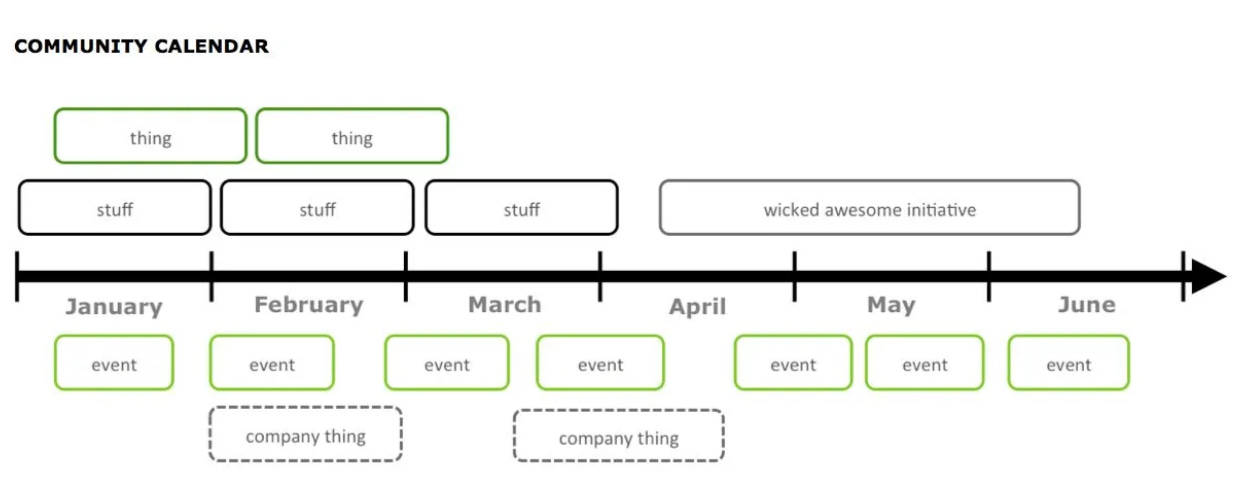
1-page PDF Format:
Keep it to a single page and avoid spreadsheets
PDF is easy to read and works well with email
Send it over by email: This is the only channel you can be sure everyone checks
Post it in any relevant channel like your Slack or Teams as well. Run people out of excuses as to why they didn't see or understand it
The Community’s ROI
Since your community contributors are also key stakeholders, it’s good to share with them what they’re getting out of their contributions.
Ask the same questions we saw before for them: What’s their goal? What’s the strategy for them? What KPI and metrics can we gather to show them they are getting closer to their goal thanks to their contributions?
This is exactly what the many successful open projects do.
Unplash shares how many visits a photographer’s picture reaches:

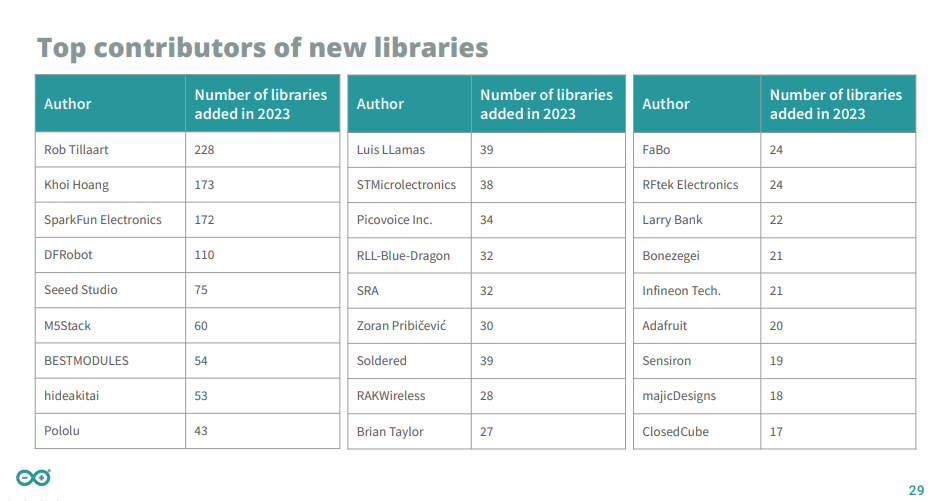
Arduino shares in their annual report a leaderboard recognising their most active contributors:
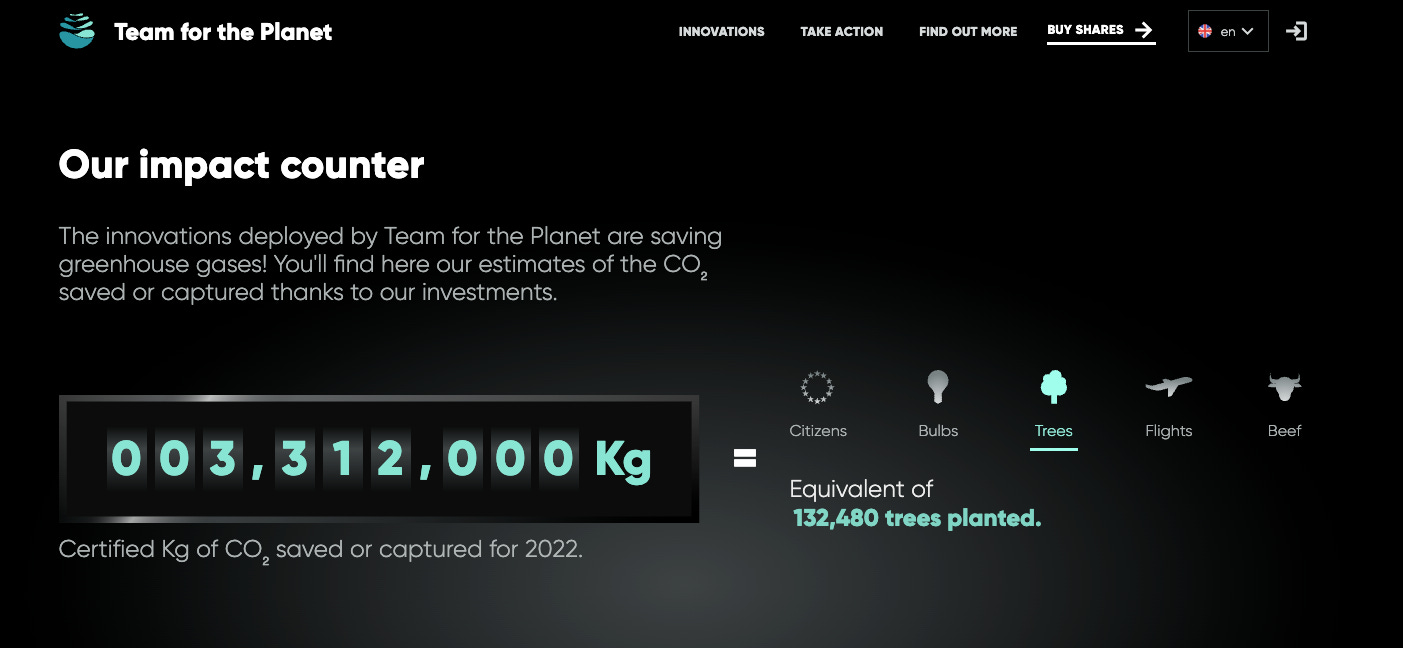
And Team for the Planet shares the impact the contributor’s money has had so far on reducing CO2:
Some Precautions To Keep In Mind
Be careful of myopic ROI targets. If we destroy our users, providers and the environment that supports us on our way to making profits, we should reconsider.
So beware of the rebound effects your initiatives have on your users health and environment. You should anticipate and measure the negative consequences your projects’s investments can have on them.
We thought ride-sharing services like Uber would decrease the use of cars, but they've actually increased CO2 emissions, Instagram’s use has also had terrible effects on teenager’s mental health, and the rise of the gig economy has actually undermined workers rights.
Or we think patents help innovators, but it’s estimated that 97% of them lose money, which is a great case for research funds to support open source innovation.
If you see that you or other actors are creating negative effects, you will now have the tools to counteract or rethink your approach and gain the support of your users, public institutions and regulators.
Talking about measuring ROI is simple, and as Richard Millington says, doing it is extremely hard, but it’s still important to talk about it.
✍️ What are your thoughts? Do you have other stories about how measuring ROI helped you gain more support for your projects?
💡 Let me know if you're going to try this. Would love to learn about your approach!
♻️ And if you found this helpful, I hope you’ll consider sharing it.
I hope this helps you raise the support you need!
TL;DR
Understand the value open source and community have for society:
What’s the direct or indirect value created or protected through the community using your open project and the cost to society if you had to suddenly stop it?Understand the value open source and community have for your organisation:
What challenges is your organisation tackling thanks to openness and community? Is it improving customer support, retention, product development, increased adoption or even driving revenue?Ask these four questions to start tracking your ROI:
Goals: What business, social or environmental challenges are we trying to solve?
Strategy: What is the approach and initiatives we will take to meet those goals and how can we align that with the community?
KPIs: How will we measure the performance of our strategy?
Metrics: What data will we need to calculate our KPIs and where can we get it?
Communicate this ROI to all your stakeholders.
Share your ROI for society through PR, for your organisation through internal channels, and also keep your community in the loop about the ROI their contributions have for them.Beware of myopic ROI measurements.
You might be increasing your profit or some other metric, but if it goes against your users, providers or the environment, readjust.
Resources to go further:
How to calculate the ROI Of Online Communities, by Feverbee
8: Just say No to Page Views, by Brian Oblinger and Erica Kuhl
9: Everyone wants a cool dashboard, by Brian Oblinger and Erica Kuhl
70: Behaviors and indicators, by Brian Oblinger and Erica Kuhl
92: Early indicators, by Brian Oblinger and Erica Kuhl
Community Metrics Template, by Brian Oblinger
Erica Kuhl’s blog: It’s All About That Data
Showing cross-functional community value to your support organization
Return on Community: ROI by Example, by Gareth Wilson /Community.inc
The Real Value of your Brand Community, by Richard Millington
The 1 page pdf is the goat of internal reporting, by Brian Oblinger
What is the ROI of community, with Max Pete
How to Find the ROI of Community Management, by Evan Hamilton
Credits
Photo by Isaac Smith on Unsplash